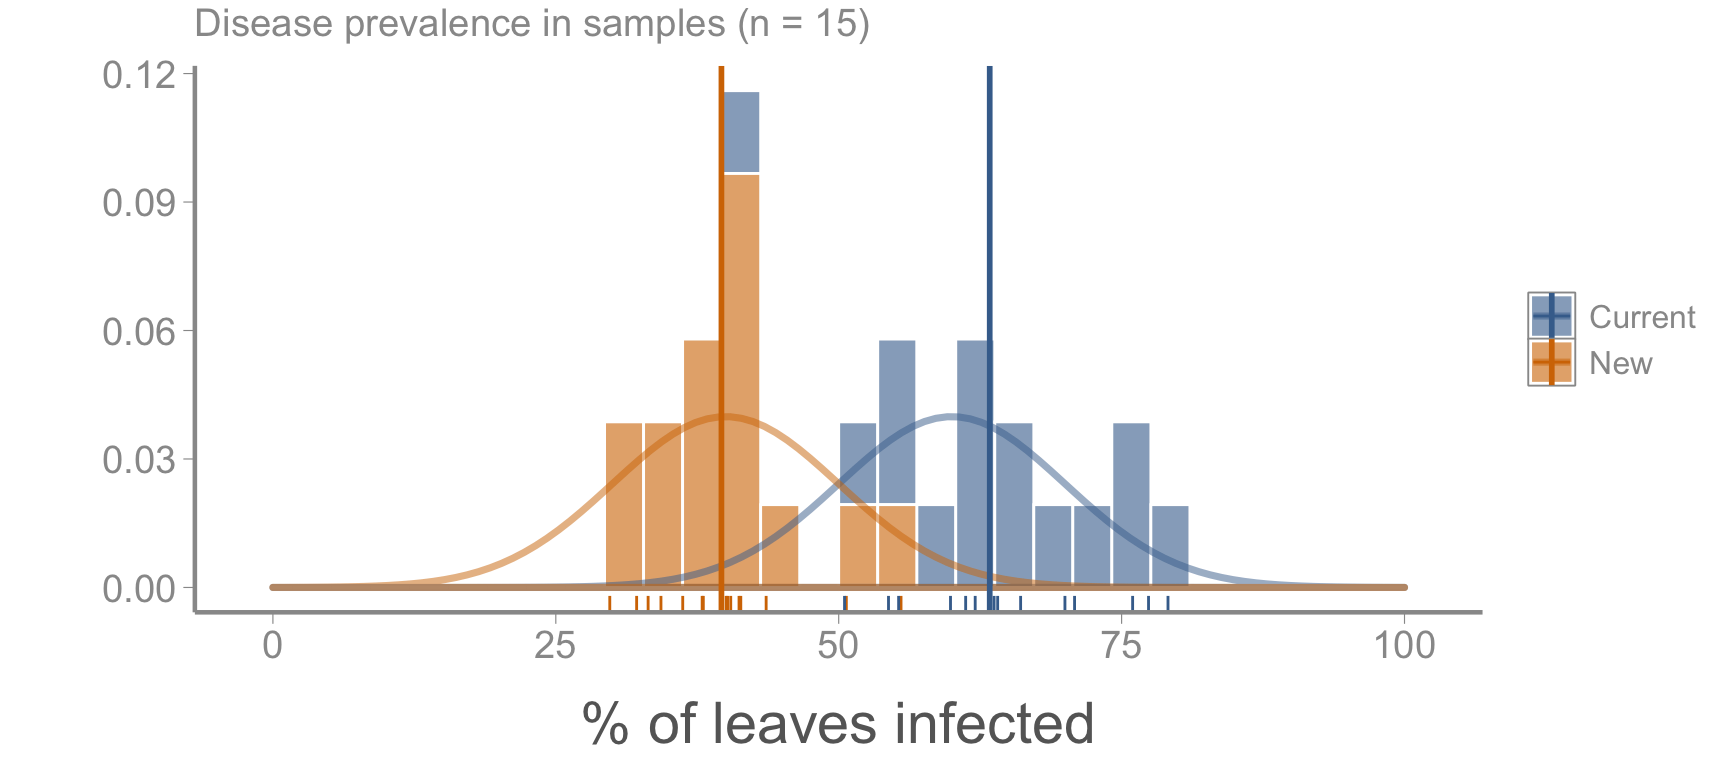
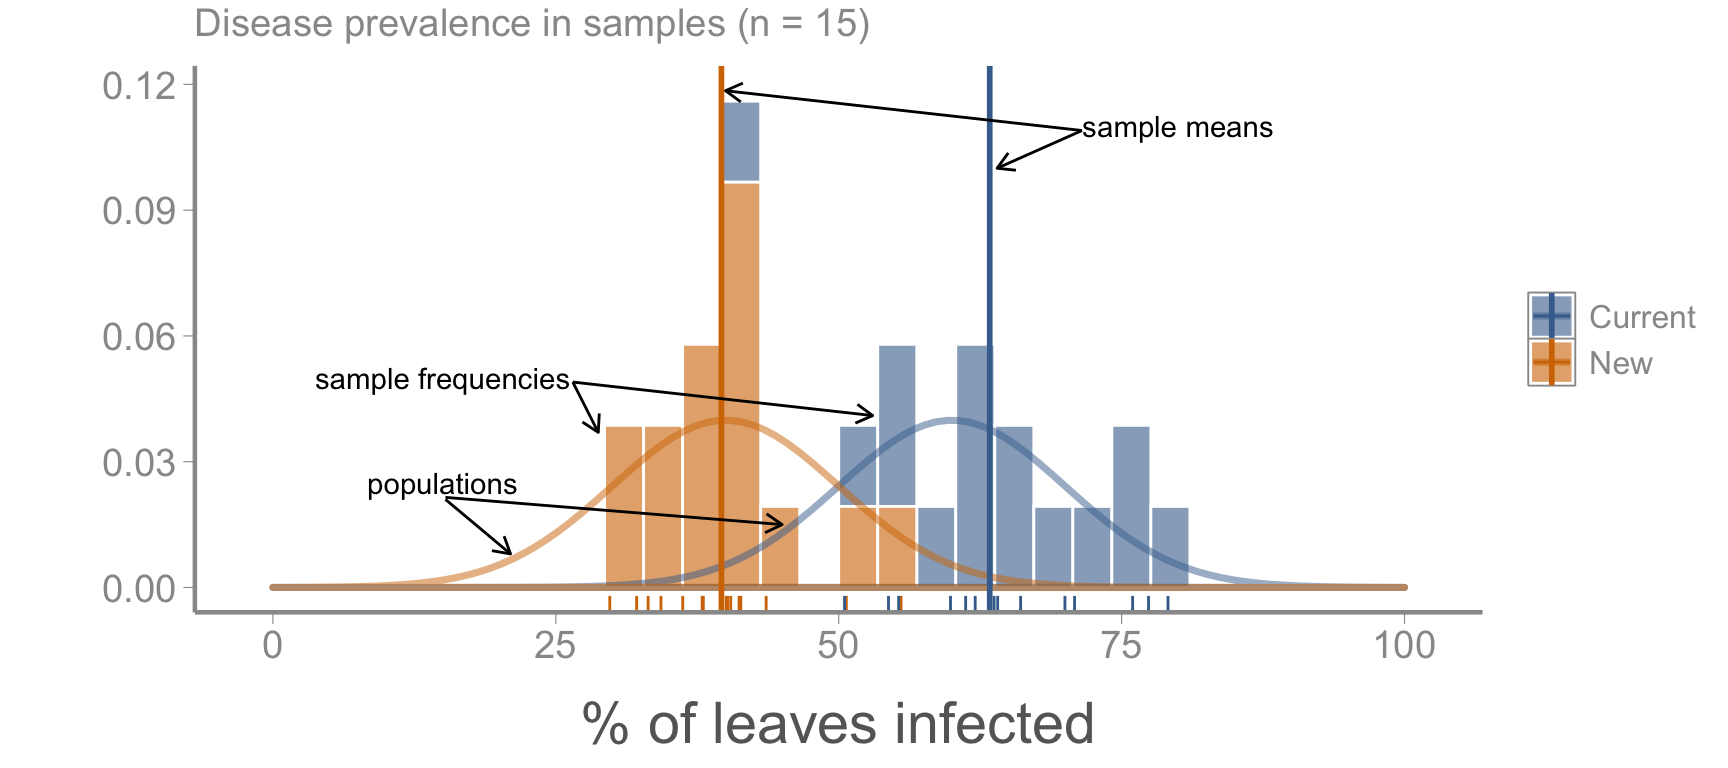
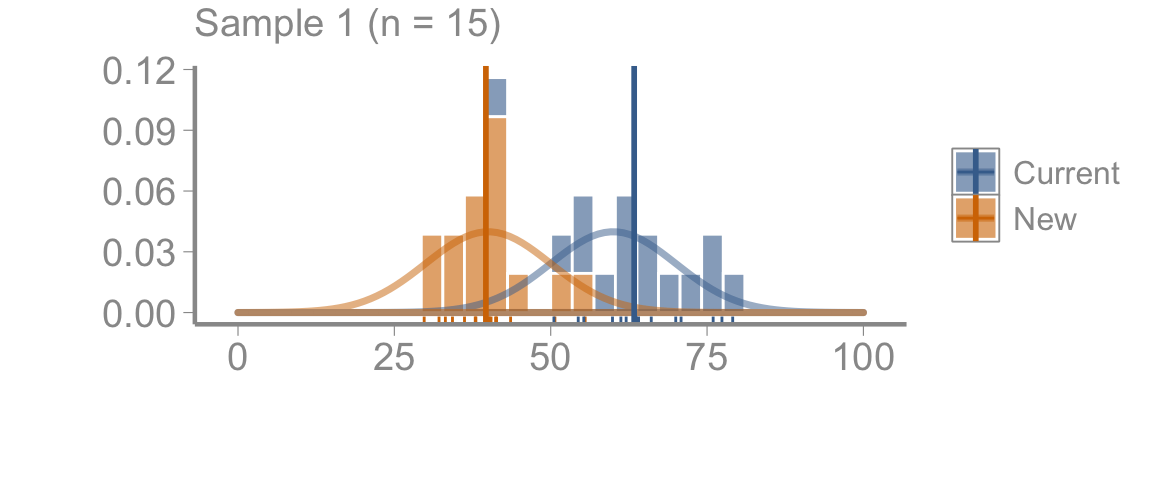
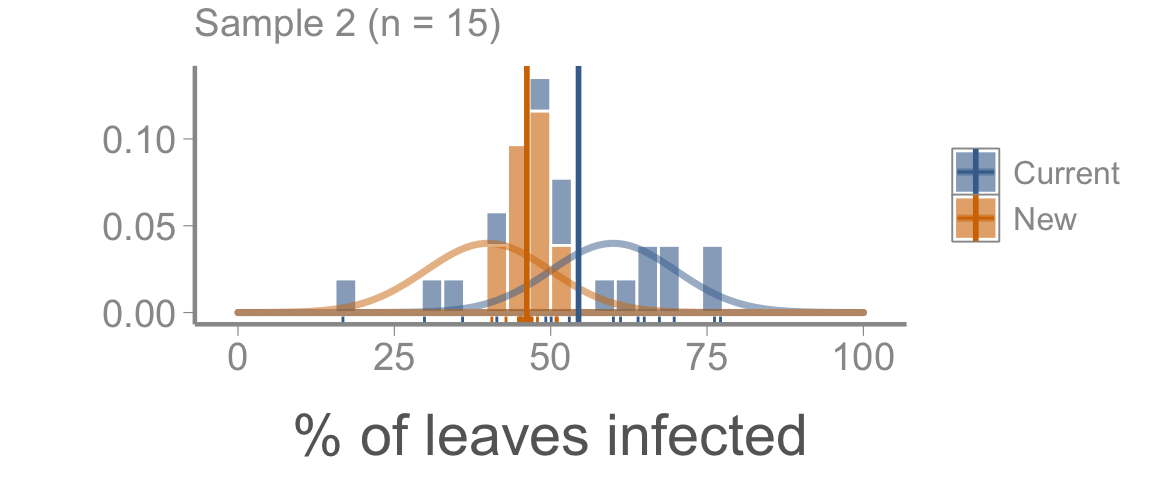
Every sample has a different mean (and standard deviation)4
Sampling = uncertainty
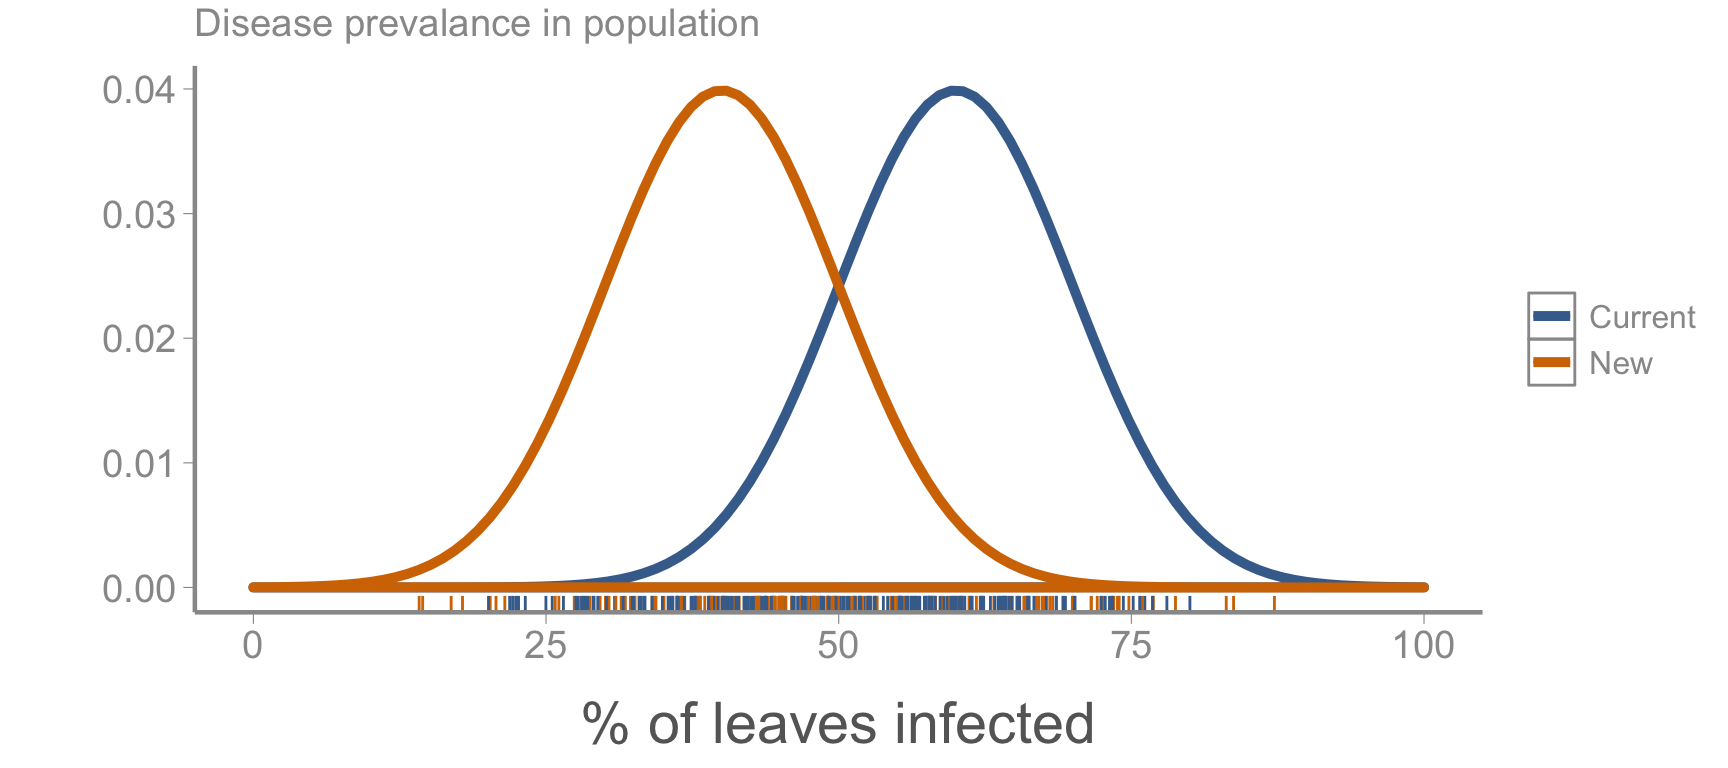
Because populations (usually) cannot be measured, sampling is essential
But sampling is inherently stochastic
Sampling produces uncertainty
Unavoidable (but that’s ok!)
Statistics is what allows us to learn about the population using samples in the face of uncertainty
The primary goal of this class is for you to understand how to make robust inferences that account for uncertainty (and the limitations of those inferences)
We will return to this basic concept (sampling error) many times this semester
Doubt is not a pleasant condition, but certainty is absurd – Voltaire
Causal inference
Causal inference
Often, we want to know whether \(x\) influences \(y\)
In other words, if we change \(x\), will \(y\) also change (and by how much)?
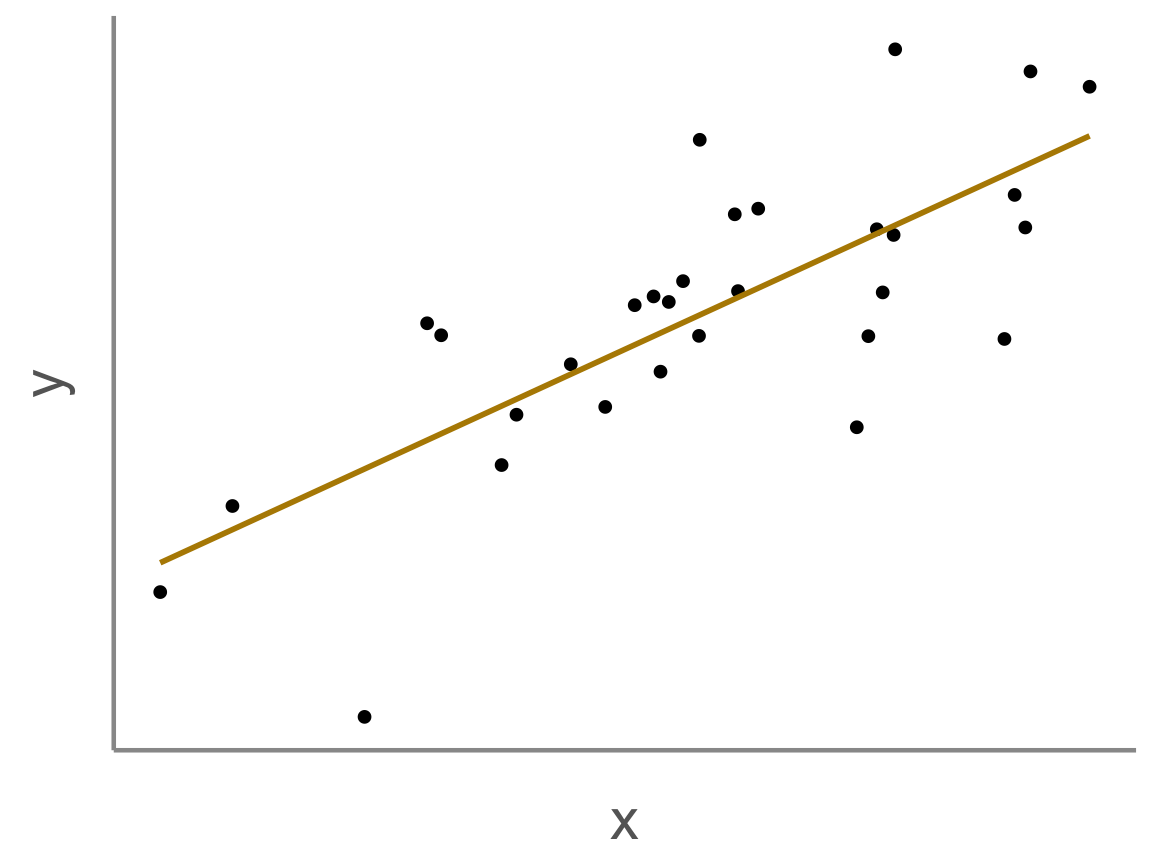
Statistical models measure associations between variables
In other words, when \(x\) changes, \(y\) also tends to change5
Do associations tell us anything about cause and effect?
Correlation is not causation
Causal inference
If correlation is not causation, what is it?
\(Correlation = Causation + Confounding + Noise\)
Confounding: Both \(x\) and \(y\) are influenced by a third variable \(z\)
Separating causation, confounding, and noise is one of the central challenges of scientific inference
Statistics can help with this challenge but cannot tell us whether associations we observe are the result of causation, confounding, or noise
Manipulative experiments are generally considered the “gold standard” for causal inference because of randomization
But causal inference from observational studies is also possible
We will discuss all of these topics in more detail throughout the semester
Summary
Statistical models allow us to quantify associations between variables
Statistical models also allow us to makes inferences about associations in the face of uncertainty
Uncertainty stems from multiple processes, the most fundamental of which is sampling
Inferences based on finite samples from a population will always be uncertain
Sampling error can make associations look bigger or smaller than they actually are
Sampling error is one of the reasons statistical associations may not be causal (or even real)
We often want to know if one variable causes another but drawing causal inferences is challenging
As we will see, causal inference is primarily a scientific challenge, not a statistical one
Note that this hypothesis is causal. Hypotheses should, in general, be causal since our goal is (usually) to learn about the mechanisms that underlie patterns we observe
We have now mentioned two types of uncertainty: The sample mean will never equal the population mean and no two samples will ever have exactly the same mean
Note the subtle difference here - in the previous sentence, we said “we change \(x\). Here, we say”when \(x\) changes. In one case, our definition is based on intervening in the system to specifically change the value of \(x\). If a change in \(y\) follows, we can (under certain circumstances) conclude \(x\) causes \(y\). In the other case, we observe a change in \(x\). Generally, we can’t conclude \(x\) causes \(y\) in that case. Why not?